Measuring Meetings
- RIZOM

- Apr 9
- 7 min read
Updated: May 11
A Leadership Framework for Reading Team Effectiveness
Meetings are where alignment forms, trust takes shape, innovation gels, and momentum either builds or dissipates. Most organisations track outputs, few can read the underlying dynamics.
Drawing on data from the Collegalli Convergence, this article introduces a practical framework that makes team dynamics visible, enabling leaders to detect early signals, interpret collective movement, and intervene with precision. The strategic implications clearly emerge.
The Collegalli Convergence
Most organisations measure meetings by their outputs: decisions made, actions assigned, time and budget spent.
These metrics capture what happened but miss what matters most:
whether the team is truly aligned,
whether trust is strengthening or eroding, and
whether momentum will extend beyond the room.
The Collegalli Convergence, a four-day gathering in Tuscany in June 2025, was designed to create momentum around a vision. RIZOM addressed that challenge by introducing its Mood Check-in protocole. Nine participants from nine countries used a lightweight symbolic check-in method across nine structured prompts. What emerged is a structured reading of the group as it evolved in real time.
The Method: From Expression to Signal
At key moments during the convergence, participants responded to brief symbolic prompts:
"What energy do you bring today?"
"If your mood were a sky, what does it look like?"
"What part of the infrastructure are you holding?"
Responses took seconds. They required no preparation, no scoring rubric, and no facilitation expertise. They draw on immediate perception rather than constructed answers.
"Periwinkle sky where swallows dance in flight"
"MAD wind and absolute still sky alternating at great speed"
"A tangle of gilded silks"
"The known unknown. The unknown, known."
Individually, these responses appear fragmentary. Collectively, they form a legible trace of how the group is functioning, which can be structured into comparable signals.
Measuring What Leaders Sense but Cannot Track
Each response (Mood Check-in) was coded across four dimensions:
Dimension | What It Captures | Why |
Clarity | How concrete and specific is the imagery? | Abstract language may signal uncertainty or integration. |
Energy | What is the emotional valence? | High energy indicates engagement; low energy may signal fatigue or reflection. |
Alignment | How convergent is the group's imagery? | Similar metaphors indicate shared direction; divergence surfaces different experiences of the same moment. |
Momentum | Is the orientation forward or reflective? | Forward momentum predicts sustained action; reflective pauses enable integration. |
These dimensions convert expression into operational indicators. Across nine prompts and 45 total responses, clear patterns emerged.
What the Data Revealed
The Symbolic Arc
The convergence followed a structured trajectory across four days.
The opening phase (Sky, Bird, Nest) showed high convergence and strong forward energy.
The integration phase (Dissolve, Dwell) introduced a deliberate descent into uncertainty.
The grounding phase (Taste, Threshold, Tree, Speak) restored momentum and stabilised it with a different profile.

The sharp drop at Prompt 4 ("What stirs as the form dissolves?") is not failure. All four metrics declined together, indicating the group entered introspection collectively rather than fragmenting. This "dissolution valley" was designed into the process, and the data confirms it worked as intended.
Phase Comparison
When aggregated by phase, the pattern becomes even clearer.
Phase | Prompts | Composite Score | Interpretation |
Opening | Sky, Bird, Nest | 4.47 | High convergence, strong energy, forward momentum |
Integration | Dissolve, Dwell | 3.02 | Deliberate descent into reflection and uncertainty |
Grounding | Taste, Threshold, Tree, Speak | 4.17 | Recovery, stabilisation, renewed forward orientation |

Opening (blue) shows the strongest profile.
Integration (orange) contracts across all dimensions.
Grounding (green) recovers with a different shape, displaying higher momentum and slightly lower clarity, which indicates that the group emerged transformed rather than simply restored.
Addressing the Reliability Question
A natural objection arises: if responses are subjective, how can they be trusted?
The framework relies on pattern integrity.
Convergence across participants strengthens the signal
Consistency across prompts confirms structural phases
Differentiation reveals roles without self-report
The objective is visibility at the collective level.
Participation as a Leadership Signal
Participation Tracks Engagement
Participation varied systematically with engagement quality.

For leaders, participation functions as a signal.
The lowest participation aligned with the lowest engagement phase.
The highest participation coincided with peak alignment and energy.
People respond when the prompt resonates. Tracking participation alongside engagement quality provides a second signal for group coherence: it indicates whether the group is following the meeting process, resisting it, or disengaging.
The Symbolic Arc
When composite engagement and participation are viewed together across the full sequence, the shape of the convergence becomes clear.
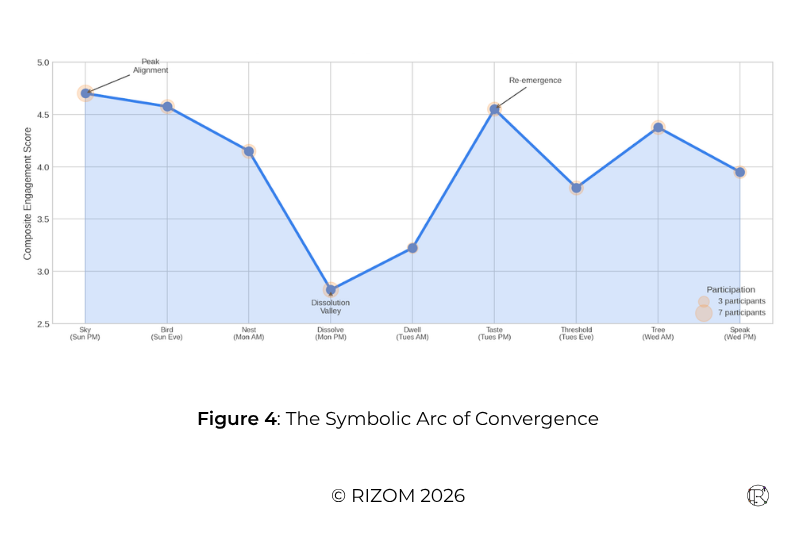
This totalising view confirms the three-phase structure: the group opened with convergence, descended through integration, and emerged with renewed momentum. The dissolution valley is visible as both a dip in score and a contraction in participation, yet the group moved through it together.
What Leadership Looks Like in the Data
One of the most revealing findings is when analysing the responses of the gathering's organiser, i.e. the person responsible for convening, facilitating, and holding the tempo of the sessions.
The facilitator’s composite score remained close to the group average.
Dimension | Facilitator | Group | Delta |
Clarity | 4.00 | 4.16 | -0.16 |
Energy | 4.12 | 4.02 | +0.10 |
Alignment | 4.12 | 4.36 | -0.24 |
Momentum | 3.94 | 3.91 | +0.02 |
The differentiation appears in the structure of the responses:
Higher energy than the group: mobilising the field
Lower alignment: introducing productive difference
Stable momentum: maintaining directional continuity
This pattern defines leadership through function rather than position.
The Tension-Holder Pattern
Where the group softened, the facilitator introduced polarity.
Where the group entered fluid states, the facilitator held paradox.
Where the group connected, the facilitator oriented toward action.
Where the group offered gentle imagery ("periwinkle sky", "breeze through trees"), the facilitator introduced productive tension as polarity: "Thunderclouds and rainbows". Drama alongside resolution.
During the dissolution phase, when the group's imagery became fluid and drifting ("a thought, long and thin", "floating space, suspended moment"), the facilitator held paradox: "The known unknown. The unknown, known." This is structurally different from dissolution: it is containment.
When asked about trees in a forest, others spoke of interconnection: roots, mycelium, shared canopy. The facilitator mobilised: "An Ent. Going to war." . signalling the guardian who rises to defend. While the group connected, the leader prepared to act.
At the threshold moment, when participants were asked what part of themselves stood still so others could move, the facilitator offered: "Silence. Before, during, after the storm." The container held through stillness, not speech.
And in the final declaration of role, the facilitator articulated what facilitative leadership actually involves: "I carry the weight until it becomes weightless. I offer elegance."
The symbolic data surfaced a leadership style that would never appear in a 360 review or personality assessment:
Higher energy than the group average > mobilising, not mirroring
Lower alignment > introducing productive difference, not enforcing consensus
Paradox-holding during difficult phases > containing what others release
Mobilising imagery when the group stayed relational > preparing for action
Silence as structural offering > holding the container through presence
This is the signature of a holding leader: one who absorbs structural burden so others experience lightness. This configuration enabled the group to move through complexity and uncertainty without loss of coherence.
The Trajectory Through Alignment-Energy Space
The most revealing visualisation maps the group's movement through two dimensions simultaneously. When mapped across Alignment and Energy, the group’s movement forms a coherent arc.

This provides a dynamic reading of the group. The sequence moved from convergence, through integration, toward renewed momentum.
It indicates that leaders gain visibility on direction, not only position.
Practical Implementation
Organisations can introduce this approach with minimal disruption.
The interaction remains light for participants. The value emerges through RIZOM’s ability to structure, interpret, and accumulate the signals over time.

Step 1: Anchor purpose
Before convening, clarify what outcome requires this interaction to happen. This disciplines meeting frequency, sharpens intentionality, and justifies presence.
Step 2: Capture the symbolic pulse
At one or two moments during the session, participants respond to a brief prompt. Responses can be collected verbally, in writing, or digitally.
The process takes under 30 seconds and is designed to surface immediate perception rather than considered evaluation.
Step 3: Structure the signal
After the meeting, responses are translated into four dimensions: Clarity, Energy, Alignment, and Momentum.
This is where RIZOM becomes essential. The prompts are simple. The interpretation is not. RIZOM provides the symbolic framework, calibrated scoring logic, and continuity of method needed to turn raw expression into comparable signal.
Step 4: Track patterns over time
Single meetings provide snapshots. Value emerges across sequences.
RIZOM tracks how patterns evolve across multiple sessions: which meetings generate alignment, where divergence appears, where energy rises or collapses, and where a leader’s pattern departs from that of the wider group.
Step 5: Link interaction to outcomes
Symbolic patterns are then correlated with business outcomes such as progress, rework, conflict, breakthrough, renewal, or erosion of trust.
Over time, the organisation develops not only a richer vocabulary for team effectiveness, but a more precise basis for intervention.
RIZOM operates at the point where expression becomes structured signal and longitudinal insight.
Strategic Implications
The Collegalli data has implications well beyond meeting design.
Resource allocation
The data shows that not all prompts generate equal engagement. Culinary metaphors such as “Taste of the Myth” scored almost as highly as the opening prompt, while more abstract dwelling prompts produced the lowest response rates. Organisations can use this insight to design interventions around prompts that reliably open participation and surface signal.
Early warning systems
The dissolution valley at Collegalli was intentional. In a business context, a similar pattern appearing unexpectedly would signal that a team is entering strain before that strain becomes visible in missed deadlines, stalled decisions, or overt conflict.
Leadership diagnostics
A leadership signature emerged without any direct question about leadership. Patterns of higher energy, lower alignment, and sustained paradox-holding became visible through the responses themselves. Symbolic data can therefore reveal who is actually holding the container, regardless of formal title or declared role.
Innovation capacity
Creative work depends on trust, shared understanding, and collective momentum. The Alignment × Energy trajectory offers a practical diagnostic for innovation teams: are they moving through healthy phases of opening, integration, and grounding, or are they trapped in low-energy, low-alignment states where progress quietly stalls?
Cultural diagnostics
When aggregated across teams, symbolic patterns reveal culture in action. Where do teams consistently converge? Where do they fragment? Where do leaders mirror the group, and where do they mobilise it? These patterns illuminate organisational strengths, fault lines, and the conditions under which coherence can be sustained.
Take-away Implications
The Collegalli Convergence demonstrated that the effectiveness of interaction can be observed systematically.
Across four days, nine prompts, and 45 responses, the data revealed:
a coherent three-phase arc from opening through integration to grounding
a measurable dissolution valley that confirmed the process was working as designed
participation patterns that tracked engagement quality
a leadership signature that emerged without asking directly about leadership
an alignment–energy trajectory that moved through distinct quadrants in sequence
This framework does not replace traditional project management. It complements it by making visible the dynamics that determine whether plans translate into outcomes.
Meetings are where alignment forms, trust builds, and momentum emerges. When those processes become visible in a structured way, organisations gain the ability to act earlier and with greater precision: before misalignment becomes conflict, before erosion becomes failure, and before the cost of a meeting exceeds its value.


Comments